Speed to Value
Lead time distribution insights - from days and months to minutes and hours. Based on 153 tickets measured from intent to main-branch merge.
Agentic
Coding
Early Findings Benchmark
Part 2: Lead Time Distribution Insights
Marcio Sete | October 2025
The first part of this research uncovered an uncomfortable signal - a productivity multiplier of 22.5× in net code.
Some dismissed it with: "Lines of code don't equal value."
Fair enough -
So I measured something harder to ignore... speed to value.
The Benchmark Setup
The elapsed time between first intent and code merged to main (trunk-based).
Two Groups
1. Pre-AI Baseline (2020–2023)
Before AI coding was a thing - my control group.
Represented by: The Value Stream Flow Report (2023) -
214 value streams, 130,908 data points across 11 industries and 4 continents.
2. Agentic Coding (Oct 2025)
Soon to be the new normal.
Represented by: One Product Engineer orchestrating a fleet of autonomous agents working in parallel in a SaaS platform codebase.
The Results
Pre-AI Baseline (2020-2023)
Lead time by performance tiers
Source: The Value Stream Flow Report (2023)
| Tier | Lead Time range (P50–P85) |
|---|---|
| Elite Performers | 1 to 13 days |
| High Performers | 14 to 22 days |
| Medium Performers | 23 to 56 days |
| Low Performers | 57+ days |
| Agentic Coding | 26m to 2h 43m |
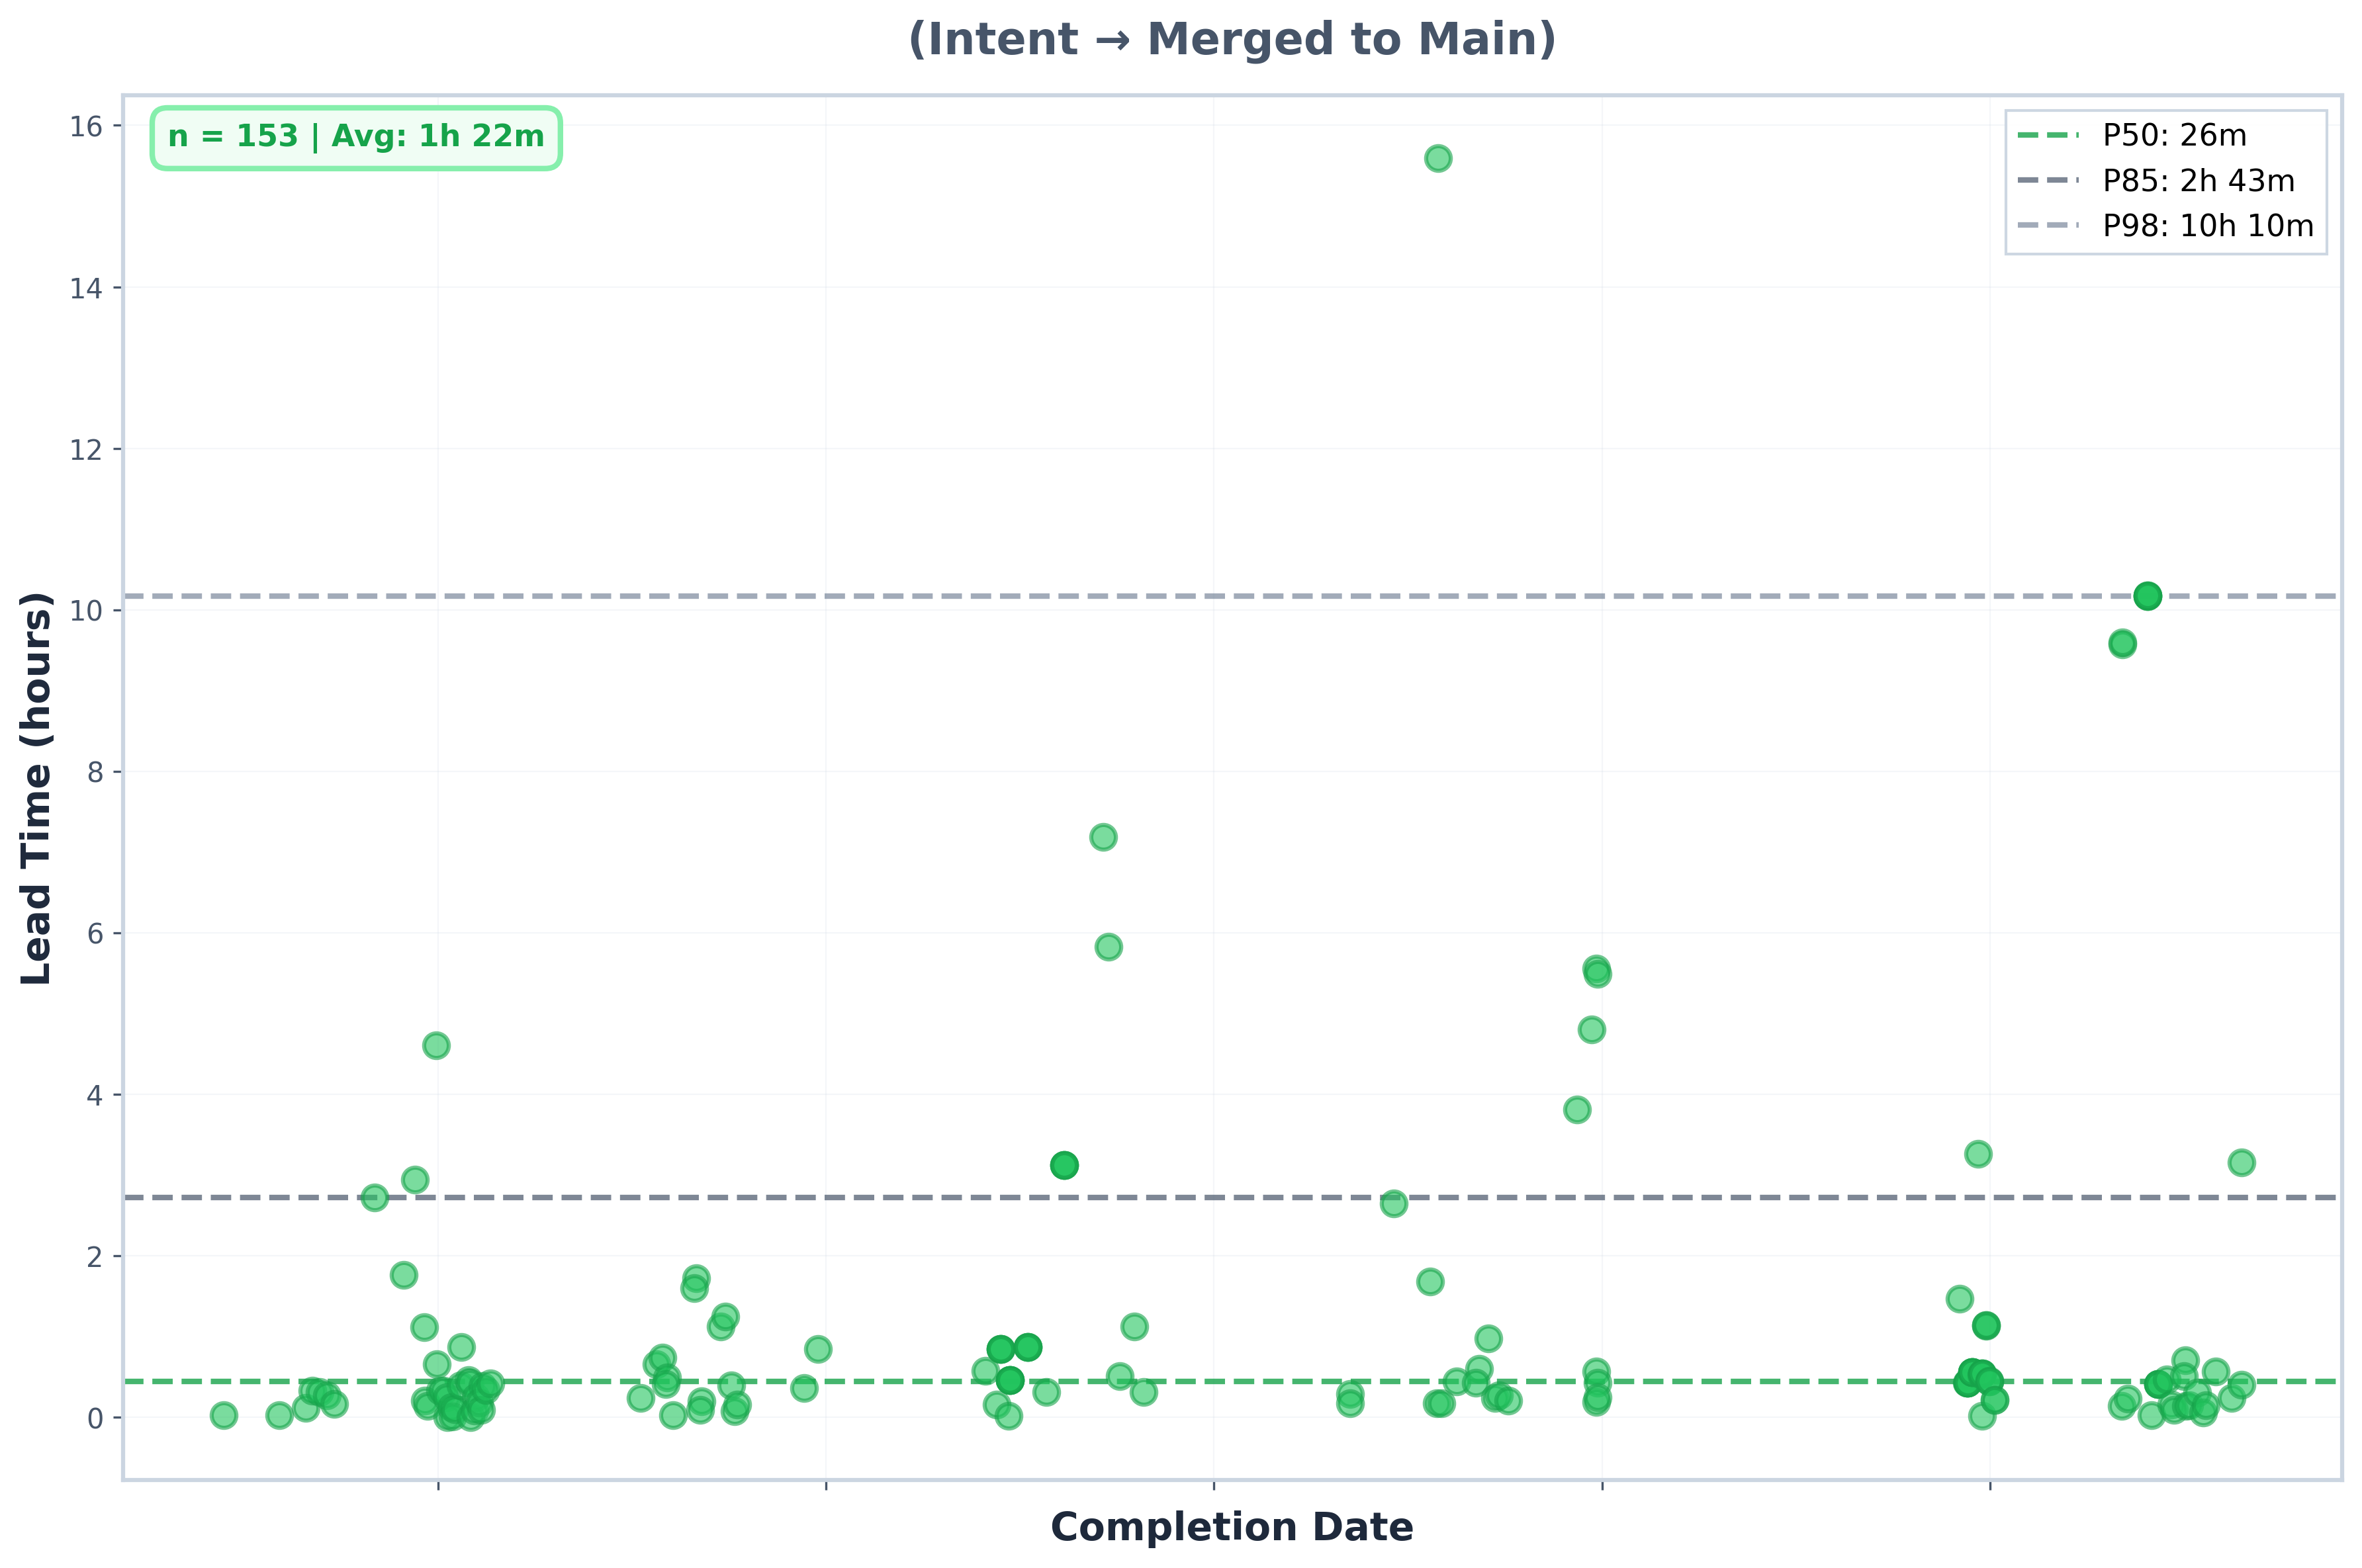
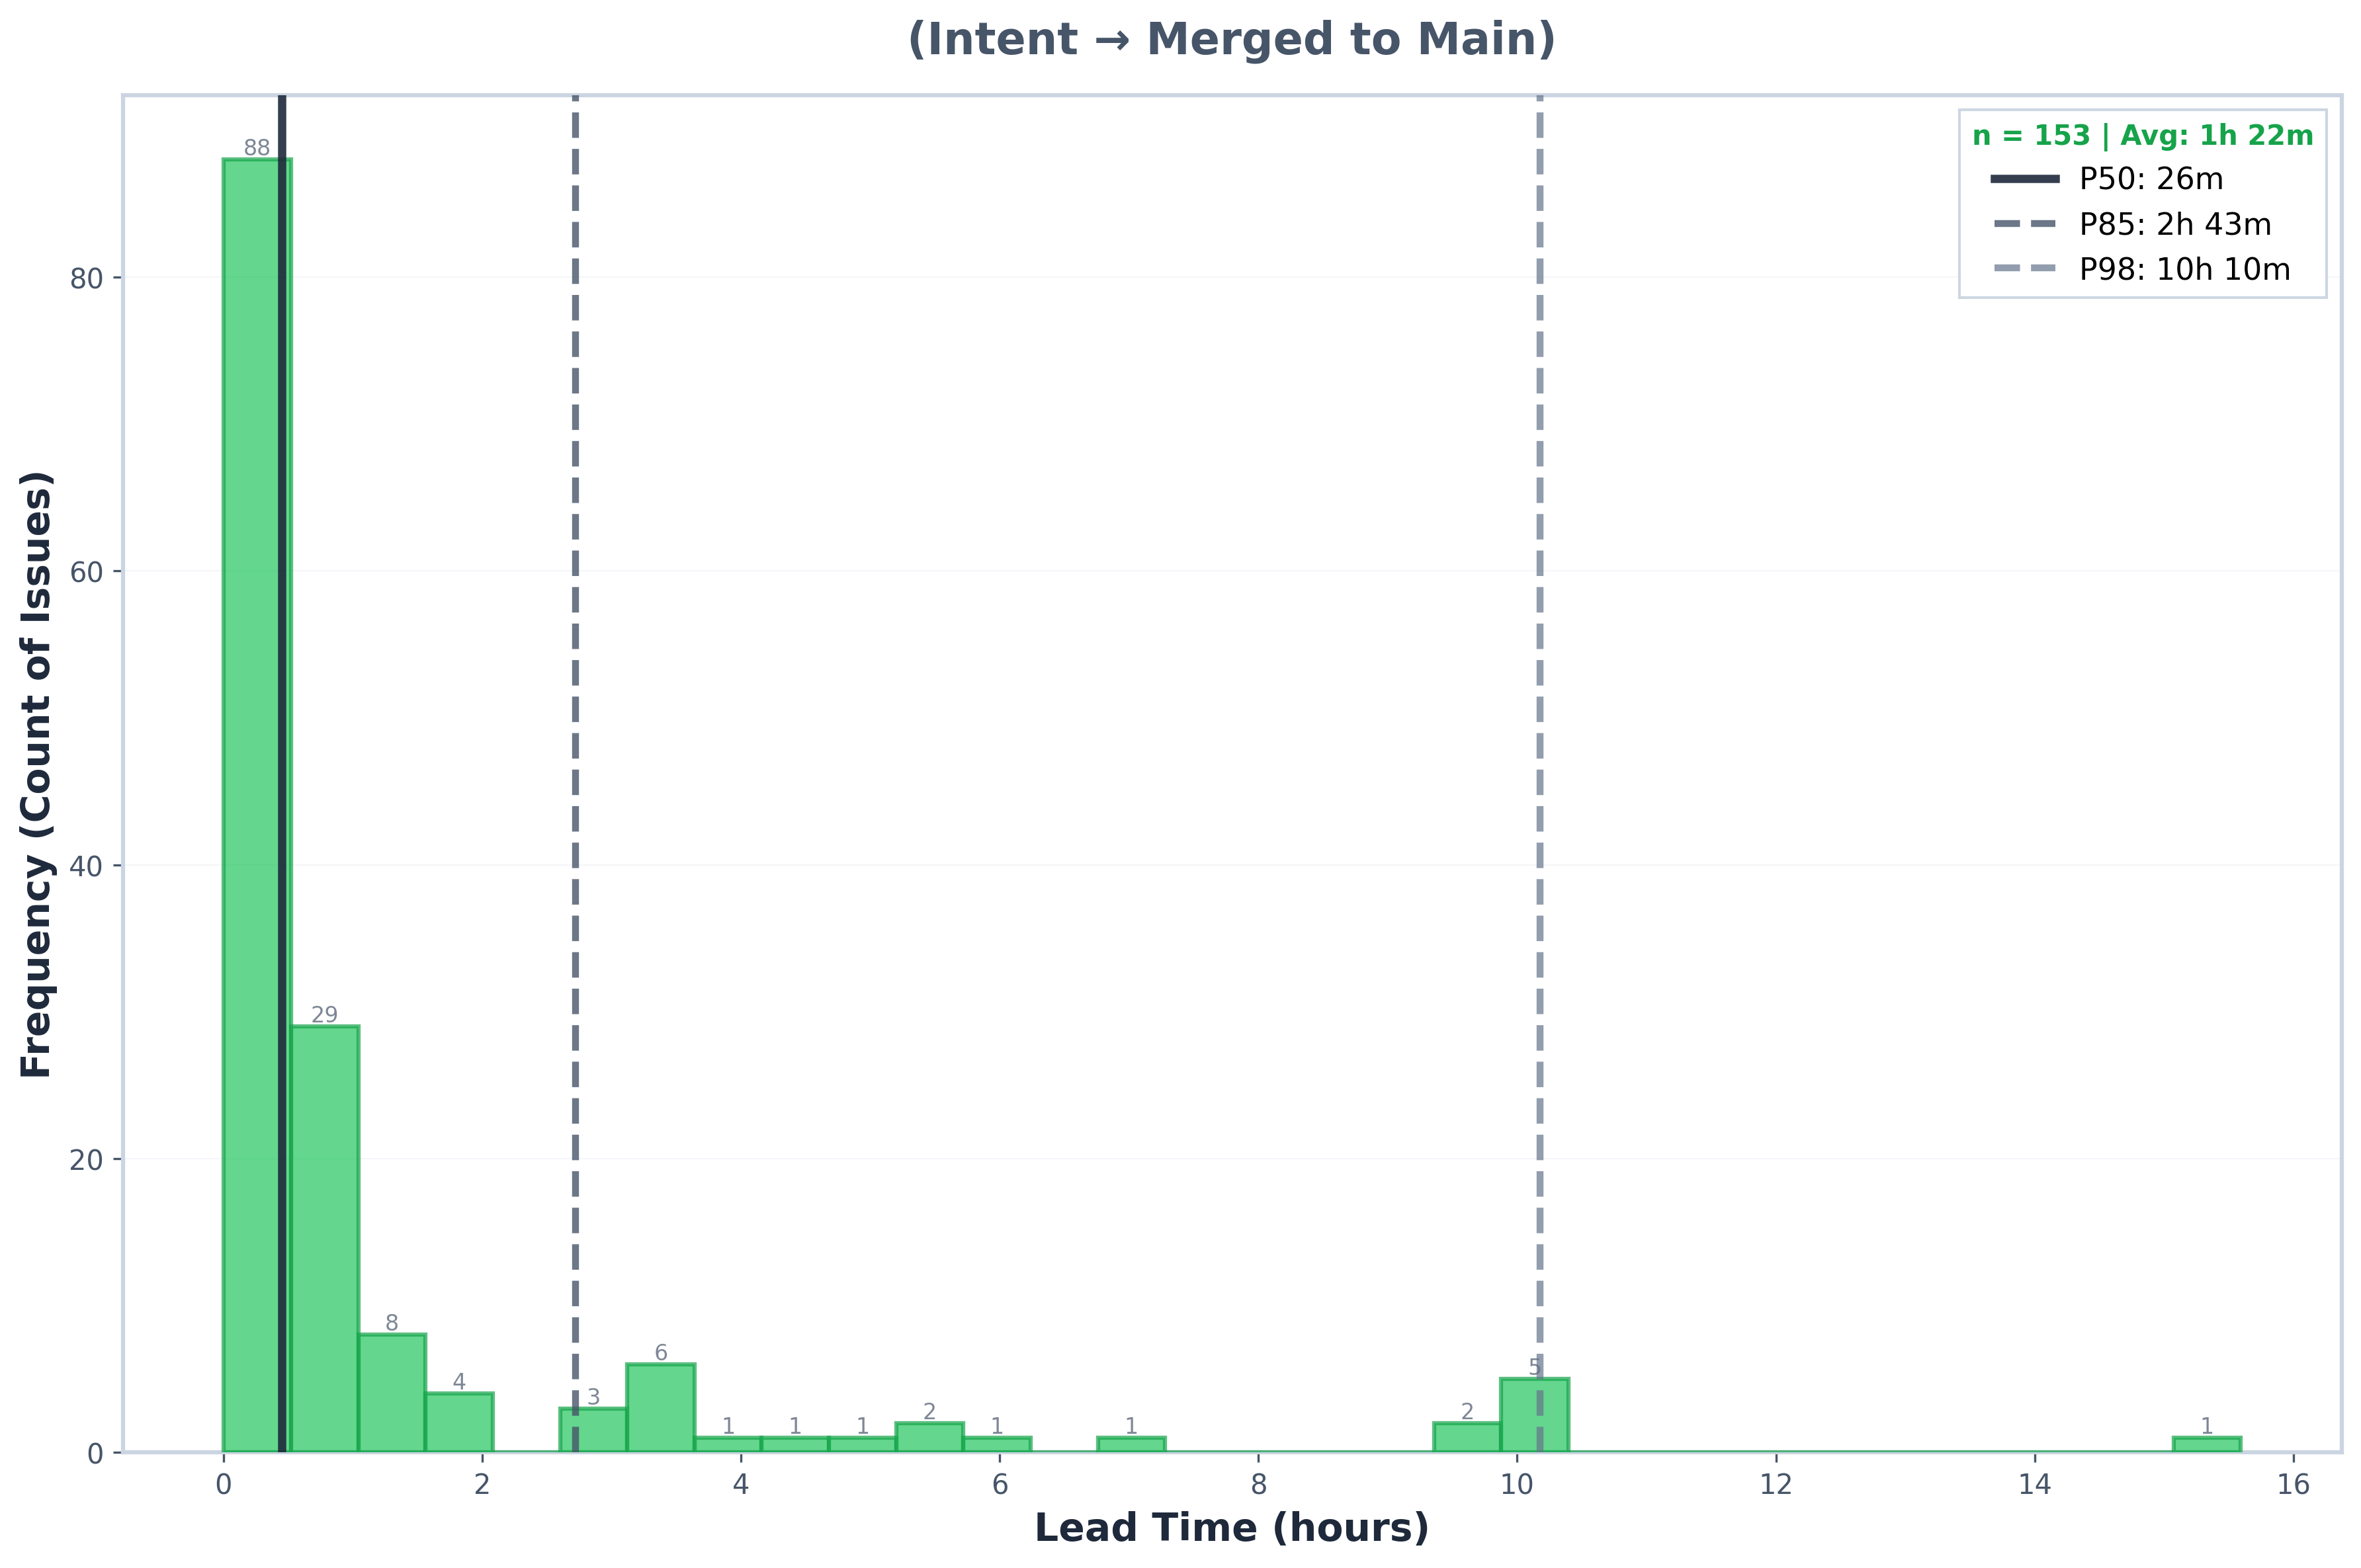
Lead Time Distribution (n = 153, intent → merged to main):
Comparability note: baseline is multi-org, multi-context; our agentic sample is single-org, trunk-based, with enforced small batch sizes. Results show feasibility/upper-bound, not median industry expectation.
Lead Time Scatterplot
Lead Time Histogram
How Agentic Distributions Behave
Strong right-skew
Median ≈26m vs mean ≈1h 22m → a small number of long items pull the average up.
Service levels
P85 ≈2h 43m, P95 ≈8h 1m, P98 ≈10h 10m. Tail ratio P98/P50 ≈ 22.6× → low predictability at the extremes.
Log-normal fits well
Log-normal fits well: log-sigma ≈ 1.48; Q–Q correlation ≈ 0.98 (typical for knowledge-work flow).
Weibull shape k ≈ 0.58 (< 1)
Decreasing hazard (items that don't finish quickly tend to linger), consistent with heavy-tailed behaviour.
Insights
Throughput profile
How much finishes how fast:
- Within 30m: ~56% of items
- Within 60m: ~76%
- ≥ 4h: ~9% (the tail that drives unpredictability)
Service-level framing
To cover 85% of work, plan ~3 hours; to cover 95%, plan ~8 hours.
Near-zero queueing
Queueing is minimal, consistent with agentic start-up behaviour-work begins almost immediately.
Would "agentic coding" make the distribution more 'normal'?
Probably not (true normals are rare in flow). What you can expect:
- Log-σ (from the log-normal view) shrinks
- Weibull k moves up toward 1 (less heavy-tailed)
- Tail ratios (P85/P50, P95/P50) drop
What This Means for Organisations
Time-to-value collapses
Weeks become hours; expect 20–100× faster flow on the right work.
Tiny teams, outsized impact
Small, agent-orchestrating pods outperform scale; leverage replaces headcount.
Work becomes orchestration
The centre of gravity shifts from writing code to designing, directing, and validating agent work.
Cost of delay compounds
Waiting destroys options; each day lost equals many features not shipped.
Second-order effects
Strategy cycles compress; portfolio bets fragment; cost of delay compounds faster.
Flow becomes the unit of value
Value is measured by elapsed time to impact, not activity or effort.
Governance moves into code
Guardrails, quality and policy live in code; oversight is continuous, not episodic.
Talent bar resets
Premium on product judgement, problem framing and socio-technical design.
Wellbeing becomes critical
High-velocity loops are cognitively taxing; sustainable cadence becomes a design constraint.
The Question
Are you brave enough to change how your organisation works - not just its tools?
How long will you wait - and what will that delay cost you?
(Agentic coding is an operating-model shift, not a plug-in.)